Curriculum-aligned benchmark ssessments: How district leaders close the gap between what’s taught and what state tests measure
By Sidhi Baweja
Sidhi leads content and SEO at AssessPrep, the AI-powered digital assessment platform serving 800+ international schools and US K-12 districts. She writes about curriculum mapping, benchmark assessment alignment, item bank design, state test blueprints, IB and Cambridge digital assessments, and the integration layer that connects what schools teach to what they measure.

A curriculum-aligned benchmark assessment is an interim test that mirrors the state test on six variables: the standard, the unit and instructional days where it’s taught, the thinking level (what the classroom teaches versus what the state test assesses), the question format, the reading difficulty, and the scenario type students will encounter on test day. When all six align, benchmark scores predict state test outcomes. When they don’t, your district has a “good benchmark, bad state test” problem.
TL;DR: the six variables that decide whether your benchmark predicts your state test
Variable | What district leaders track | What most curriculum maps miss |
|---|---|---|
Standard | State or national standard code | Usually covered |
Unit + instructional days | When it’s taught, how many real days it gets | Days are aspirational, not actual |
Thinking level (taught vs assessed) | Recall / application / reasoning split, in class and on the state test | Rarely tagged; teacher-built benchmarks tilt to recall |
Question format | MC, drag-and-drop, fill in the blank etc | Benchmarks default to multiple choice |
Reading difficulty | Lexile band match to state test | Easier passages create false confidence |
Scenario type | Real-world vs abstract framing | Abstract benchmarks lead to freezing on test day |
What is curriculum mapping, and why most maps stop too early
Curriculum mapping is the process districts use to organise what gets taught, when, and how it’s assessed. A curriculum map shows units, lessons, standards, pacing, key skills, and the assessments tied to each. At its best, it gives a curriculum director a single view of what every classroom in the district is supposed to be doing in any given week. At its worst, it gives the same view of what teachers are planning to do, which is not the same thing.
There are several common map types: vertical (how learning builds from grade to grade), horizontal (what’s taught across subjects in the same grade), consensus (collaborative team agreement), essential (the non-negotiables), and projected (the start-of-year plan). All of them are useful. None of them, on their own, tell you whether your benchmark assessments will predict state test performance. These map types come from Heidi Hayes Jacobs, who pioneered curriculum mapping.
Here is why. Most curriculum mapping work in K-12 districts captures two of the six variables that matter: the standard and the unit it lives in. Some maps add a pacing guide, which gets you most of the way to instructional days, until you compare planned days to actual days. Almost none track the thinking level taught versus the thinking level the state test will assess, the question format students will see, the reading difficulty of the passages, or the scenario type the items use. Those four blind spots are where benchmark-to-state-test alignment dies quietly.
Most curriculum maps tell you what teachers plan to teach. Very few tell you whether the benchmark afterwards will look like the state test.
That is the gap this guide is about, and it is the gap an Atlas + AssessPrep integration is built to close.
Why your benchmark scores don’t predict state test performance
If you’ve ever briefed a board on strong benchmark results, watched state test scores come in lower, and tried to explain the gap, you’ve met the operational version of the urgency gap. Roughly 60% of K-12 grades don’t match standardized test scores, and more than 40% were inflated. The same gap shows up at the benchmark level. Benchmarks that mirror the state test on all six variables tend to track state results closely. Benchmarks that match on only one or two tend to diverge sharply.
A benchmark assessment is an interim test, given mid-year or at the end of a unit, that’s supposed to forecast state test readiness. What is a benchmark assessment in practice depends entirely on how it was built. If a coordinator copied last year’s items, rearranged them, and called the result a benchmark, that’s not aligned. If the items were pulled from a tagged item bank, filtered to match the standard, thinking level, format, Lexile, and scenario type of the state test blueprint, that is.
A common formative assessment or an interim assessment can do the same job, but only if the same six variables are honoured. The label doesn’t matter. The alignment does.
The label on the assessment doesn’t matter. The six-variable alignment does.
Many teacher-built benchmarks come up short on variable 3 (thinking level) and variable 4 (question format). This is rarely about how carefully they are written. Building higher-order, mixed-format items by hand is genuinely hard and time-consuming, so recall-style multiple-choice questions tend to win by default. The result is a benchmark that looks reassuring and that students score well on, yet predicts the state test poorly. The fix is not “test more.” It is to wire the curriculum map to the item bank so alignment is built in from the start, instead of resting on each teacher’s limited prep time.
Variable 1: The standard, table stakes but not enough on its own
Every functioning curriculum map covers the standard. State codes, Common Core codes, NGSS codes, IB criteria, whatever standards a district uses, they’re tagged at the unit level. This is the part most districts get right.
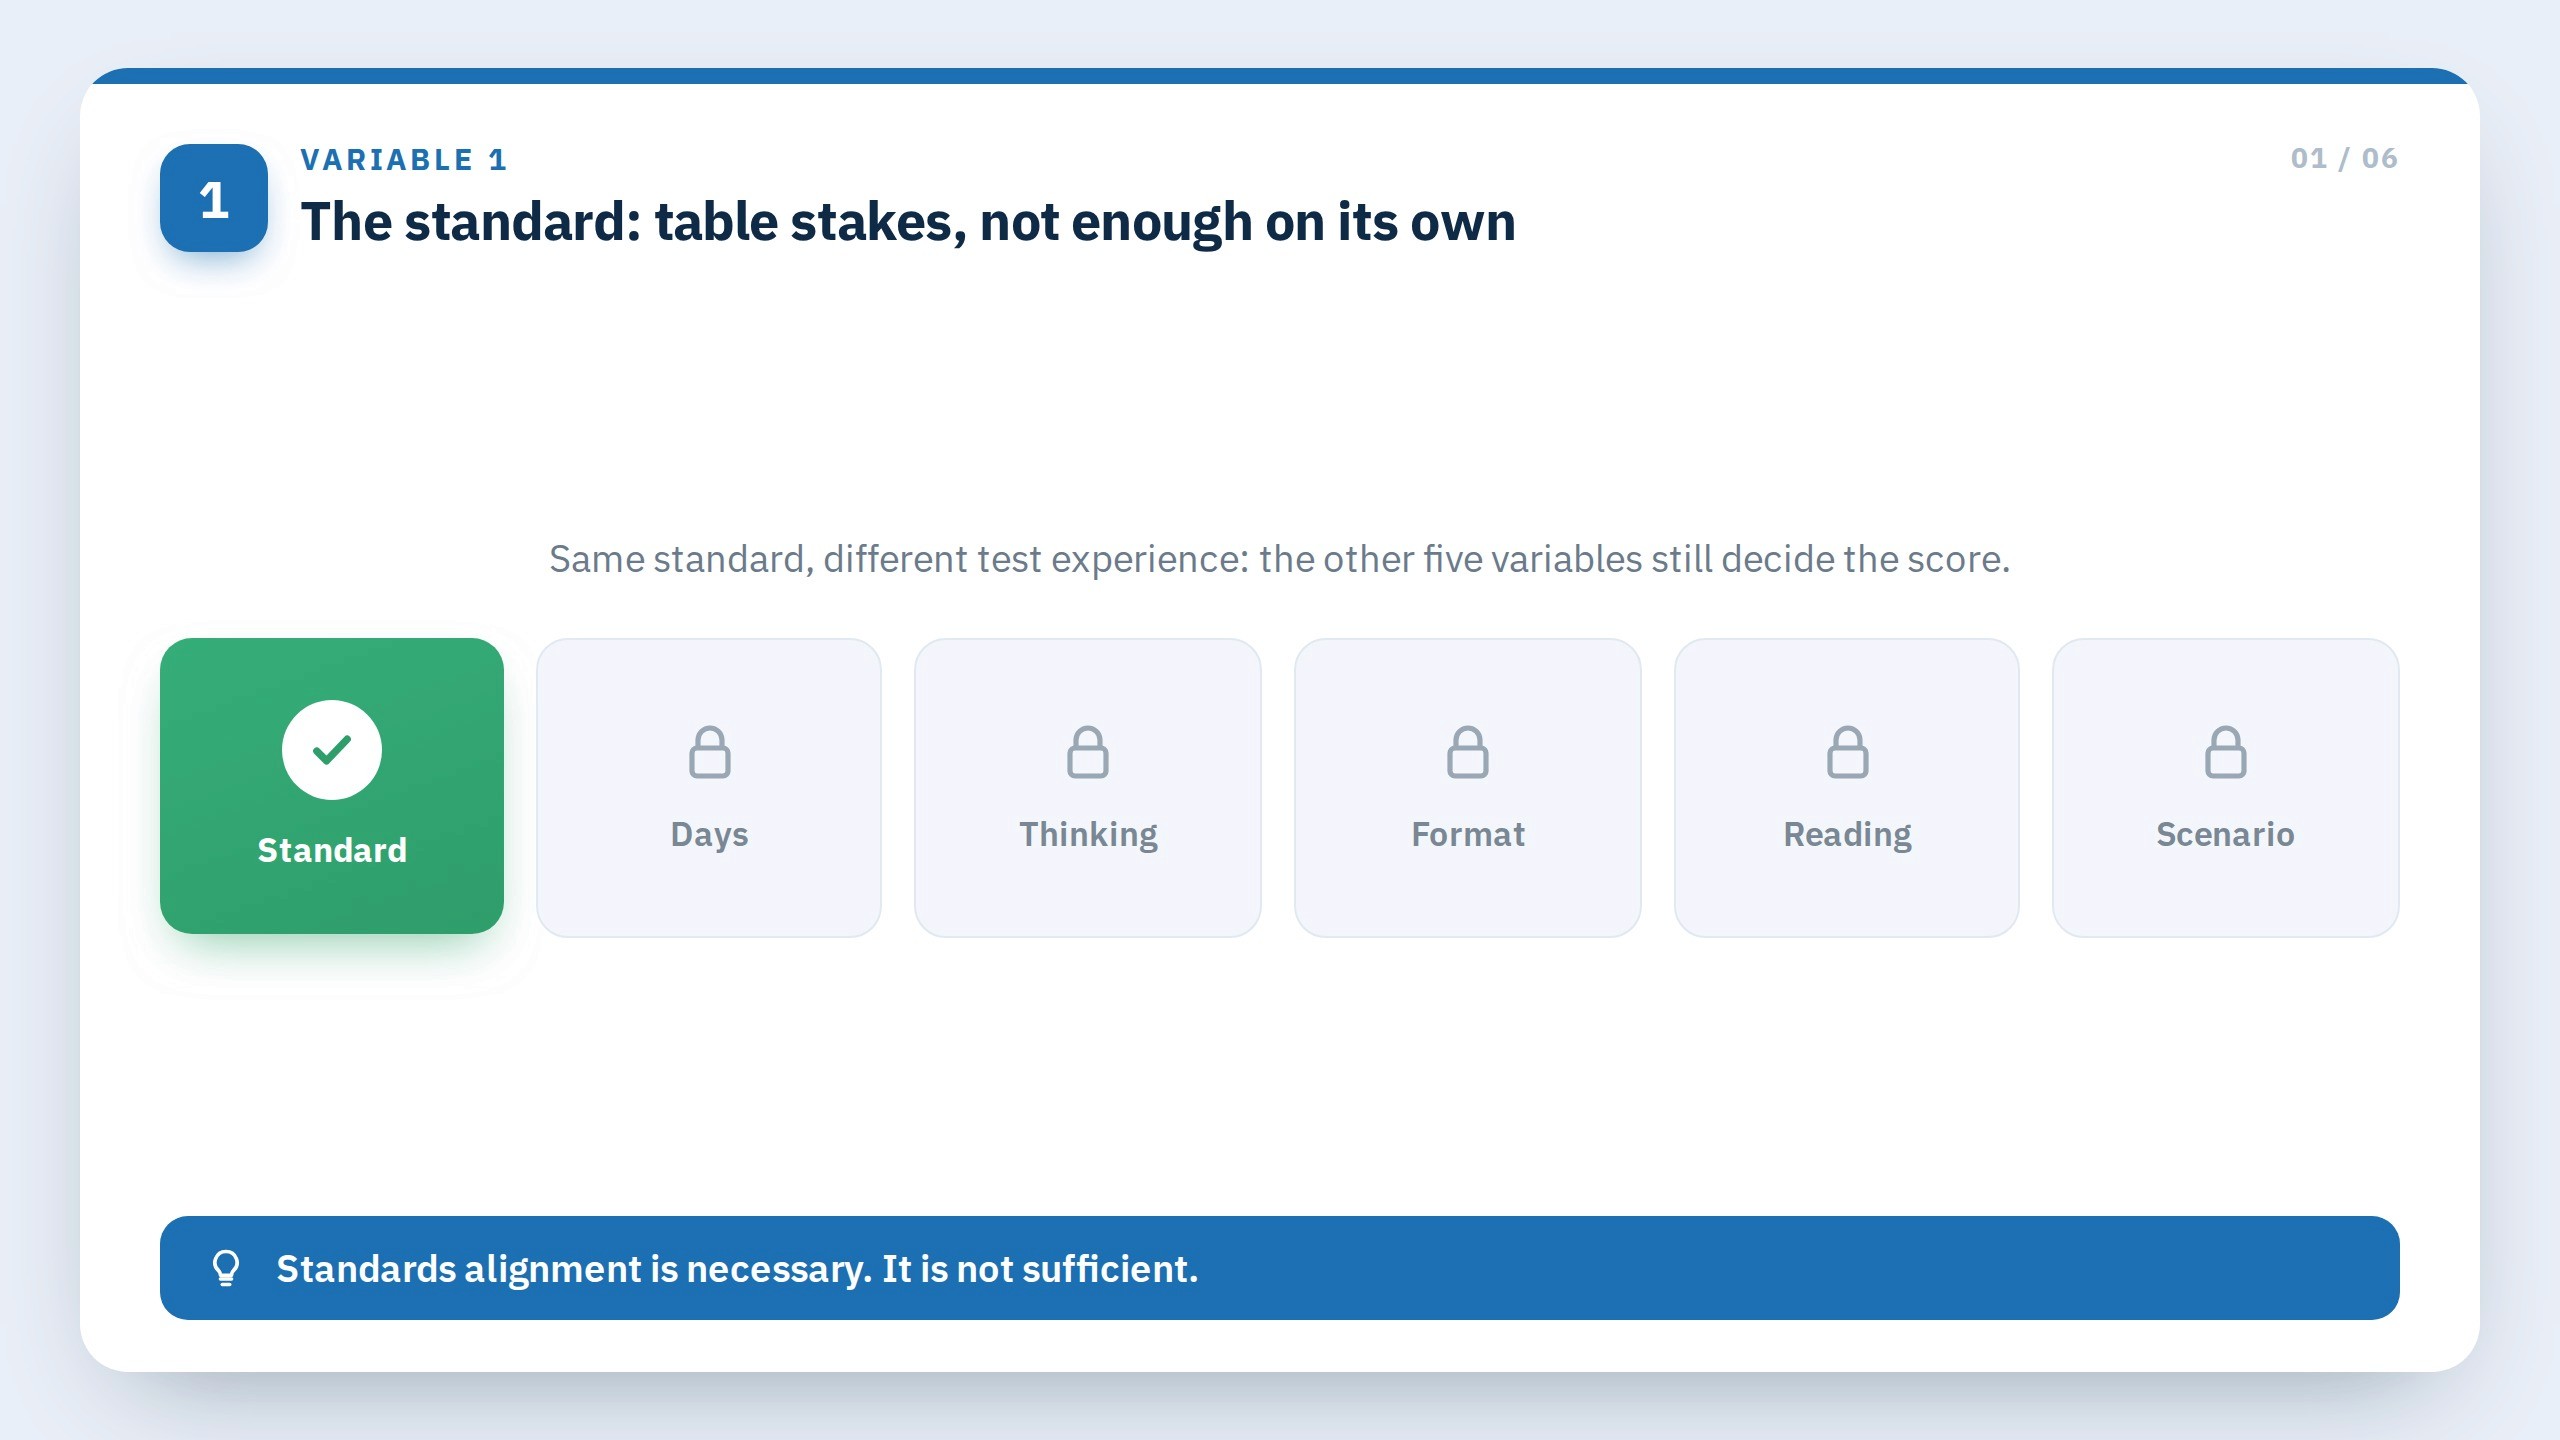
The trap is treating standard coverage as sufficient. A unit can hit standard 5.NBT.B.7 (“add, subtract, multiply, and divide decimals to hundredths”) and a benchmark can hit the same standard, and still miss the state test entirely, because the state test items operate at a different thinking level, in a different question format, against different reading load, in different scenario contexts. Same standard, different test experience.
Standards alignment is necessary. It is not enough. When the other five variables go unchecked, a benchmark can still carry the standards aligned assessment label and still miss the test. It is the most common blind spot in district benchmark programs, and rarely anyone’s fault: it is simply what happens when alignment stops at the standard. The research basis is decades old: Norman Webb’s alignment criteria established that matching the standard is only one of several dimensions of test alignment. The six variables in this guide are AssessPrep’s practitioner framework: our synthesis of that alignment research, including Webb’s criteria plus the reading-difficulty and scenario-design research, translated into the things a district can actually tag, build, and check. They are not Webb’s exact list, but they are grounded in it.
Variable 2: Where it’s taught, the unit and the instructional days that actually exist
Atlas, the dominant K-12 curriculum mapping platform, tracks where a standard is taught at the unit level and at the day level. That’s the planning view. The harder question is whether the planned days survive the school year.
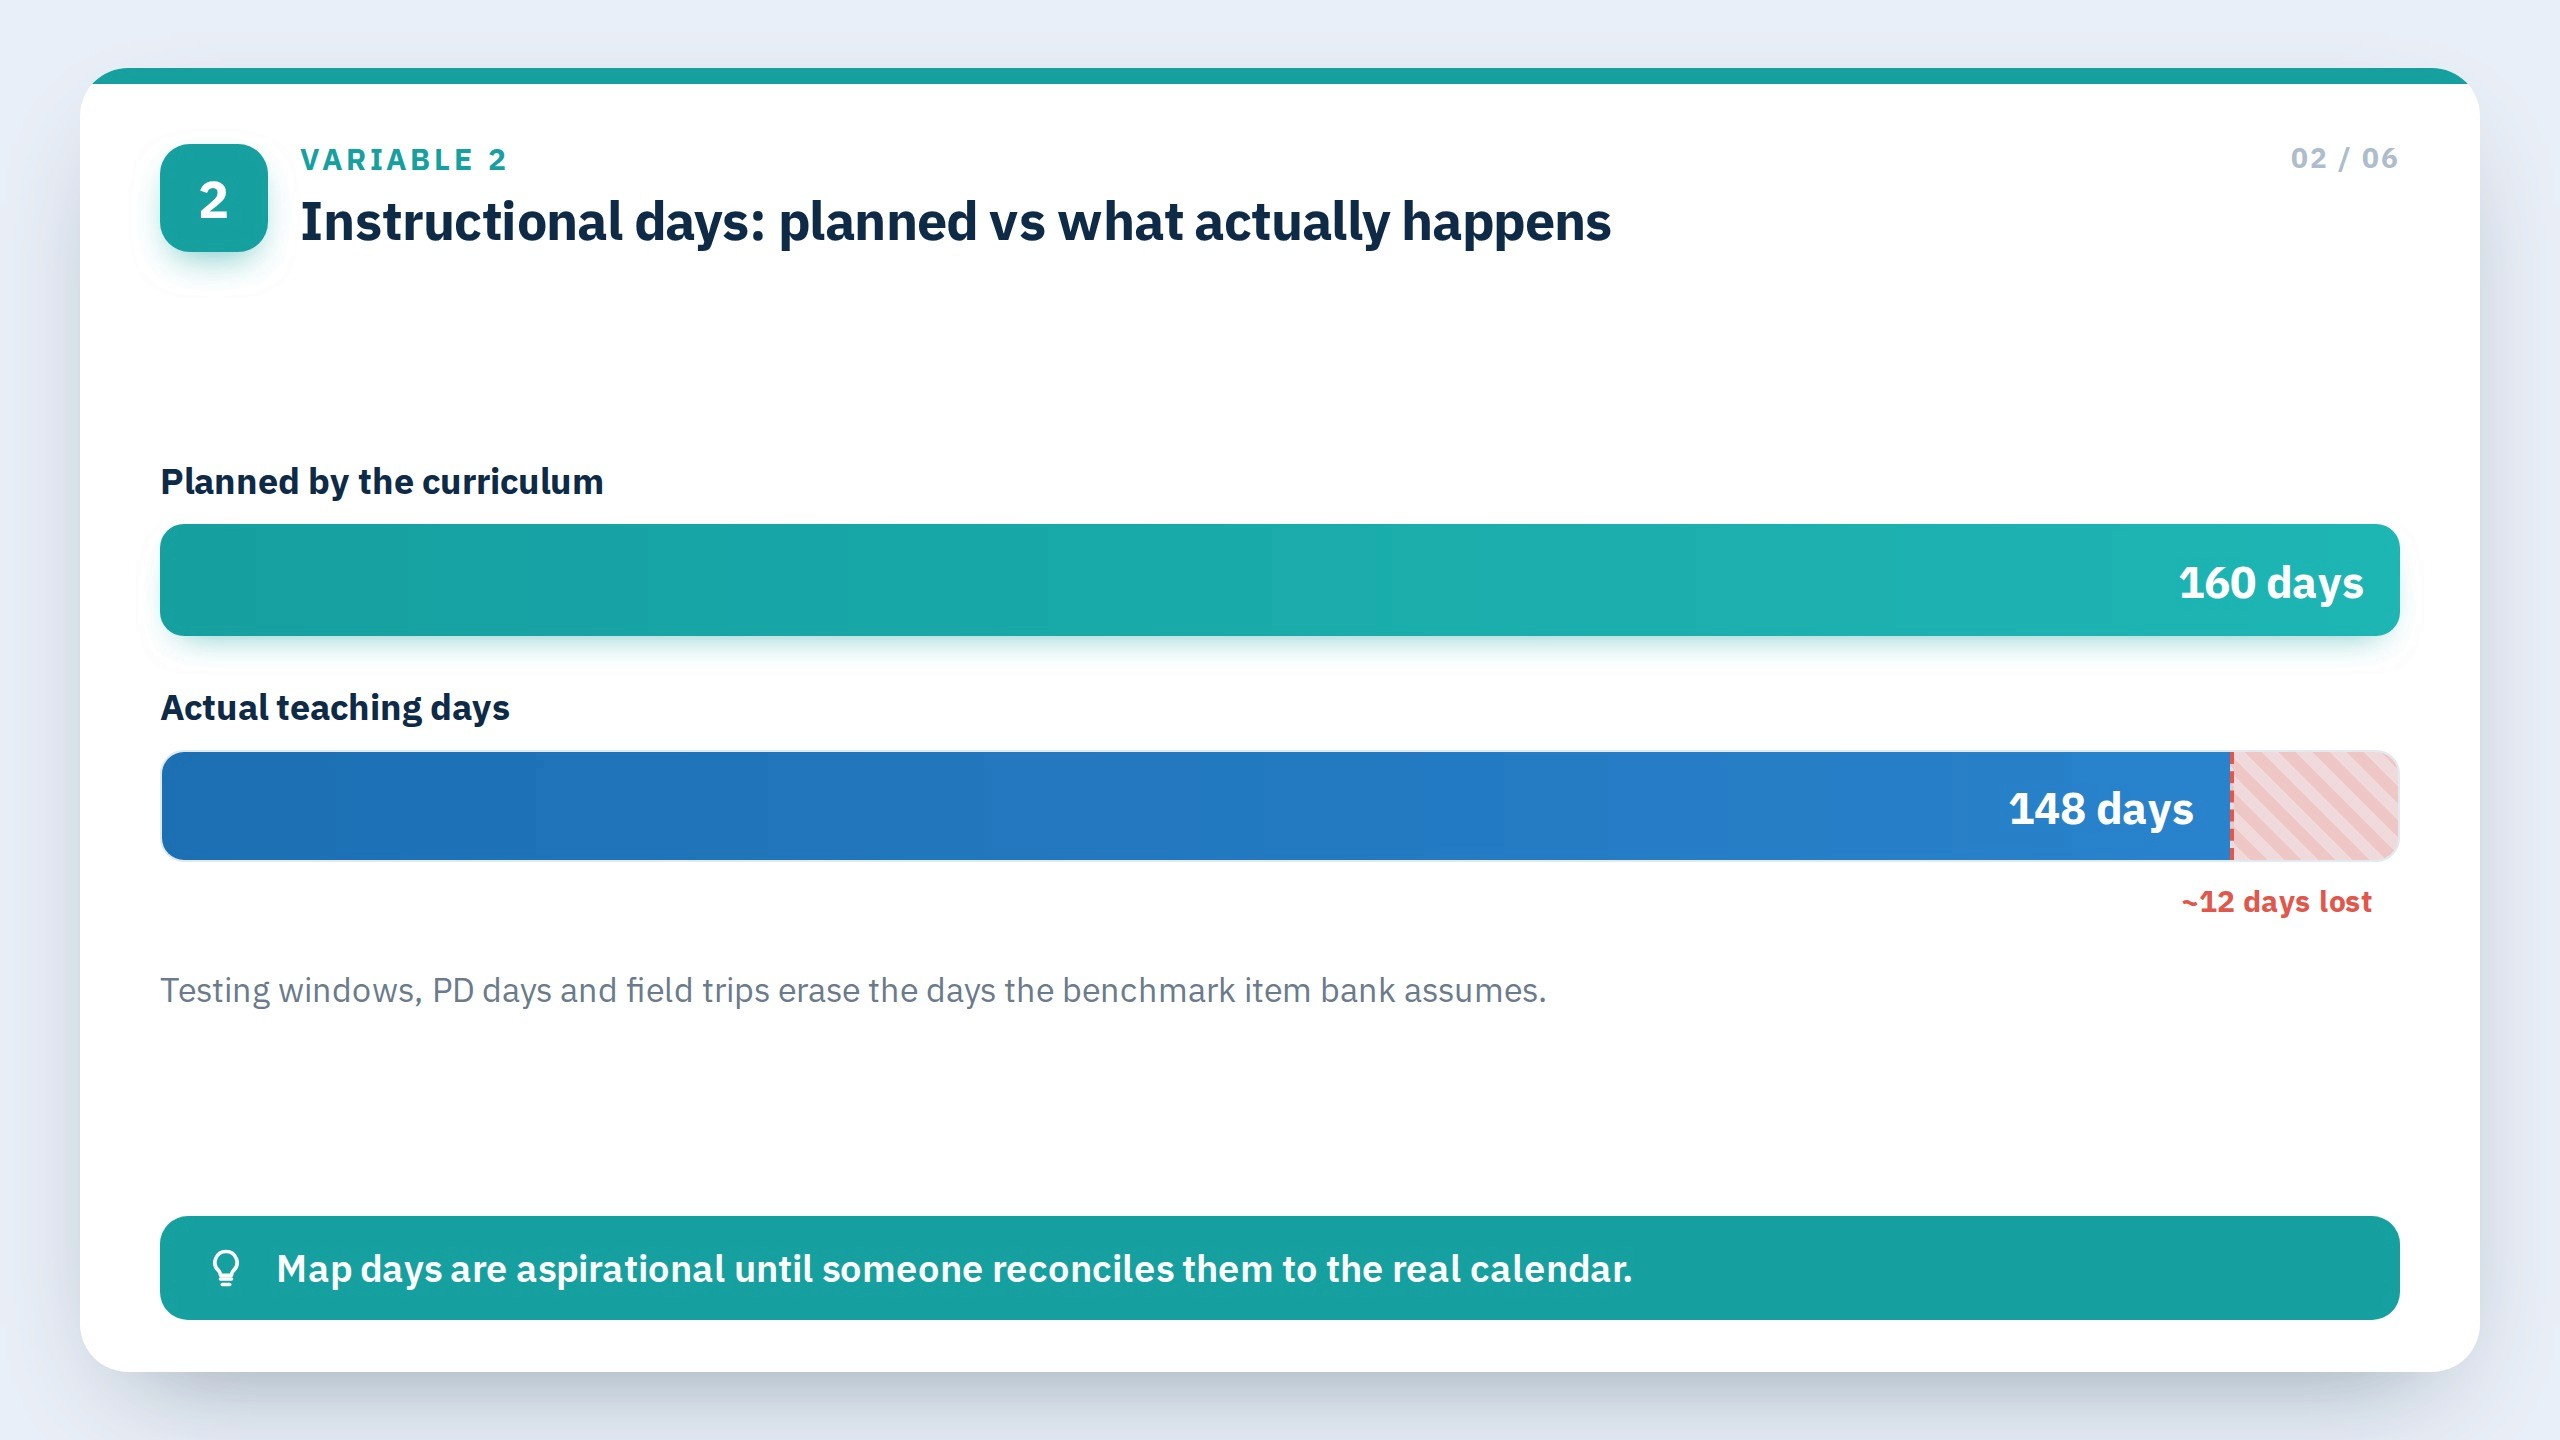
Instruction Partners’ 2023 research put real numbers on this. Curriculum publishers usually design their programs for about 160 days of teaching. A real school year rarely offers that much. Once you subtract testing windows and the normal interruptions of a school year, many schools are left with closer to 148 teaching days, a meaningful shortfall against what the curriculum assumes. You cannot fit 160 lessons into 148 days, so teachers adapt: they skip the hardest tasks or speed through units to keep pace. That is not bad teaching; it is a reasonable response to a calendar that was never going to fit the plan.
For a curriculum director, this means the days listed in the curriculum map are aspirational unless someone is reconciling them to the actual calendar. The unit that was supposed to get a set number of days might be getting far fewer. The unit that got compressed by the field trip and the state ELA testing week is the one where the benchmark item bank still expects the full original foundation. That is where item-level performance quietly breaks down.
The days in the curriculum map are aspirational unless someone is reconciling them to the actual calendar.
What helps is a workflow that attaches both the planned days and the realised days to each unit, and surfaces the gap to the curriculum director before benchmark season starts.
Variable 3: Thinking level taught vs thinking level assessed
This is the single most under-managed variable in district benchmark programs, and it’s where teacher-built benchmarks fail most often.

A state test is engineered. Its items are written to a blueprint that deliberately mixes recall, applying skills in routine situations, and reasoning across novel contexts. A benchmark built almost entirely from recall questions leaves students unready for the rest, and the gap only surfaces on test day. Alignment here means making sure students have met that full range of thinking and the test’s question formats, not copying the state test’s exact proportions. Assessment research warns against mirroring the state test too literally, since a benchmark that simply clones the blueprint narrows the curriculum. The stronger move is to cover the same range of demands and then go broader and deeper, using open-ended and performance tasks the state test has no room for.
Teacher-built benchmarks tend to tilt toward recall. This is a familiar pattern: recall items are the fastest to write and grade, so they often crowd out higher-order questions. The benchmark looks rigorous, students score well, and the resulting confidence is false. On the state test, those same students meet the applying-skills items and slow down. They meet the reasoning items and freeze.
Closing this gap requires different types of tags on every item: the thinking level taught (which lives in the curriculum map) and the thinking level assessed (which lives in the item bank). Because items are tagged this way, a coordinator can check whether the benchmark’s thinking-level mix matches the state test blueprint before it’s administered.
A benchmark that’s almost all recall produces students who feel ready and aren’t.
This is the alignment variable AssessPrep was built around. Every item in the AssessPrep bank carries a thinking-level tag. The platform won’t stop you from building a benchmark that’s all recall, but it will tell you that’s what you’ve built before you give it to students.
Variable 4: Question format, same interaction types as the state test
Students slow down and lose confidence when they meet a question format they have never practised. State tests today are not multiple choice tests. They are mixed-format tests that include items like drag-and-drop, type-the-answer, multi-select, and short constructed-response, alongside traditional multiple choice. A student who can answer the multiple-choice version of a question confidently can lose real time figuring out how to drag the right phrase into the right column when the question is reformatted.

The benchmark default is multiple choice, because it is faster to author and easier to auto-grade than the constructed-response and technology-enhanced items that state tests rely on. It is also the wrong shape if the state test uses six interaction types. When students hit interactions they haven’t practised on test day, what happens isn’t a knowledge failure. It’s an interface failure. They get the answer right in their head and lose time, or lose confidence, formatting it for the screen.
It is tempting to make this mechanical: pull your state’s blueprint, count the interaction types, and force your benchmark bank to match those proportions exactly. That goes too far. As the alignment research above cautions, cloning the test’s format mix too literally just narrows what students get to practise. What students actually need is exposure. By test day they should have worked with drag-and-drop, type-the-answer, multi-select, and short constructed-response items often enough that none of them is a surprise. Cover the full range of formats and then go broader, using open-ended and performance tasks the state test has no room for, rather than rationing your benchmarks to copy one test’s blueprint.
AssessPrep’s item authoring supports 10+ question types; a coordinator can build a benchmark whose format mix mirrors the state test and check it against the blueprint before publishing.
Students don’t fail formats they’ve never seen; they freeze in them. Format alignment is the cheapest predictive-validity win district leaders can buy.
Variable 5: Reading difficulty, matching the state test band
Passages on a state test are calibrated to a grade-level reading difficulty, and the Lexile measure is one common way US K-12 districts quantify that difficulty. The reading load climbs as the grade levels climb, so an upper-grade passage asks more of a reader than a lower-grade one. The exact target band varies by state and by grade, so a district’s testing or assessment office is the place to confirm the range that applies to its own students.

Benchmark passages are often easier than state test passages. A teacher building a quick formative check may pick a passage that’s accessible to the class, which is the right move pedagogically but the wrong move for state test alignment. Easier passages can produce higher benchmark scores and a benchmark-to-state-test prediction gap.
AssessPrep does not assign Lexile scores to items, so reading difficulty is not a tagged field you filter on. Where AssessPrep helps is in two places. First, a translation accommodation lets a student translate a word into their home language, so a math or science item measures the concept rather than English reading ability. That matters most for English-language learners, who can know the content but get blocked by the language. Second, AI authoring lets a teacher make a passage easier or harder to match the grade-level load. The reading-difficulty target itself still comes from your state’s testing or assessment office.
Two operational moves close this variable. First, if possible, tag passages in the item bank with its reading-difficulty measure (Lexile or your state’s equivalent). Second, set a target reading-difficulty band per grade per benchmark cycle that matches the state test, and require the item bank’s filter to enforce it. A coordinator should not have to think about reading difficulty while building a benchmark. The platform should enforce it.
Variable 6: Scenario type, real-world vs abstract framing
State tests today are written with scenarios. The math question isn’t “solve for x,” it’s “Maria is buying paint for a community garden; the paint costs $8.95 per quart and she has $80; how many quarts can she buy and how much money will she have left?” The science question isn’t “what is a control variable?” It’s a four-paragraph experimental design followed by three items.
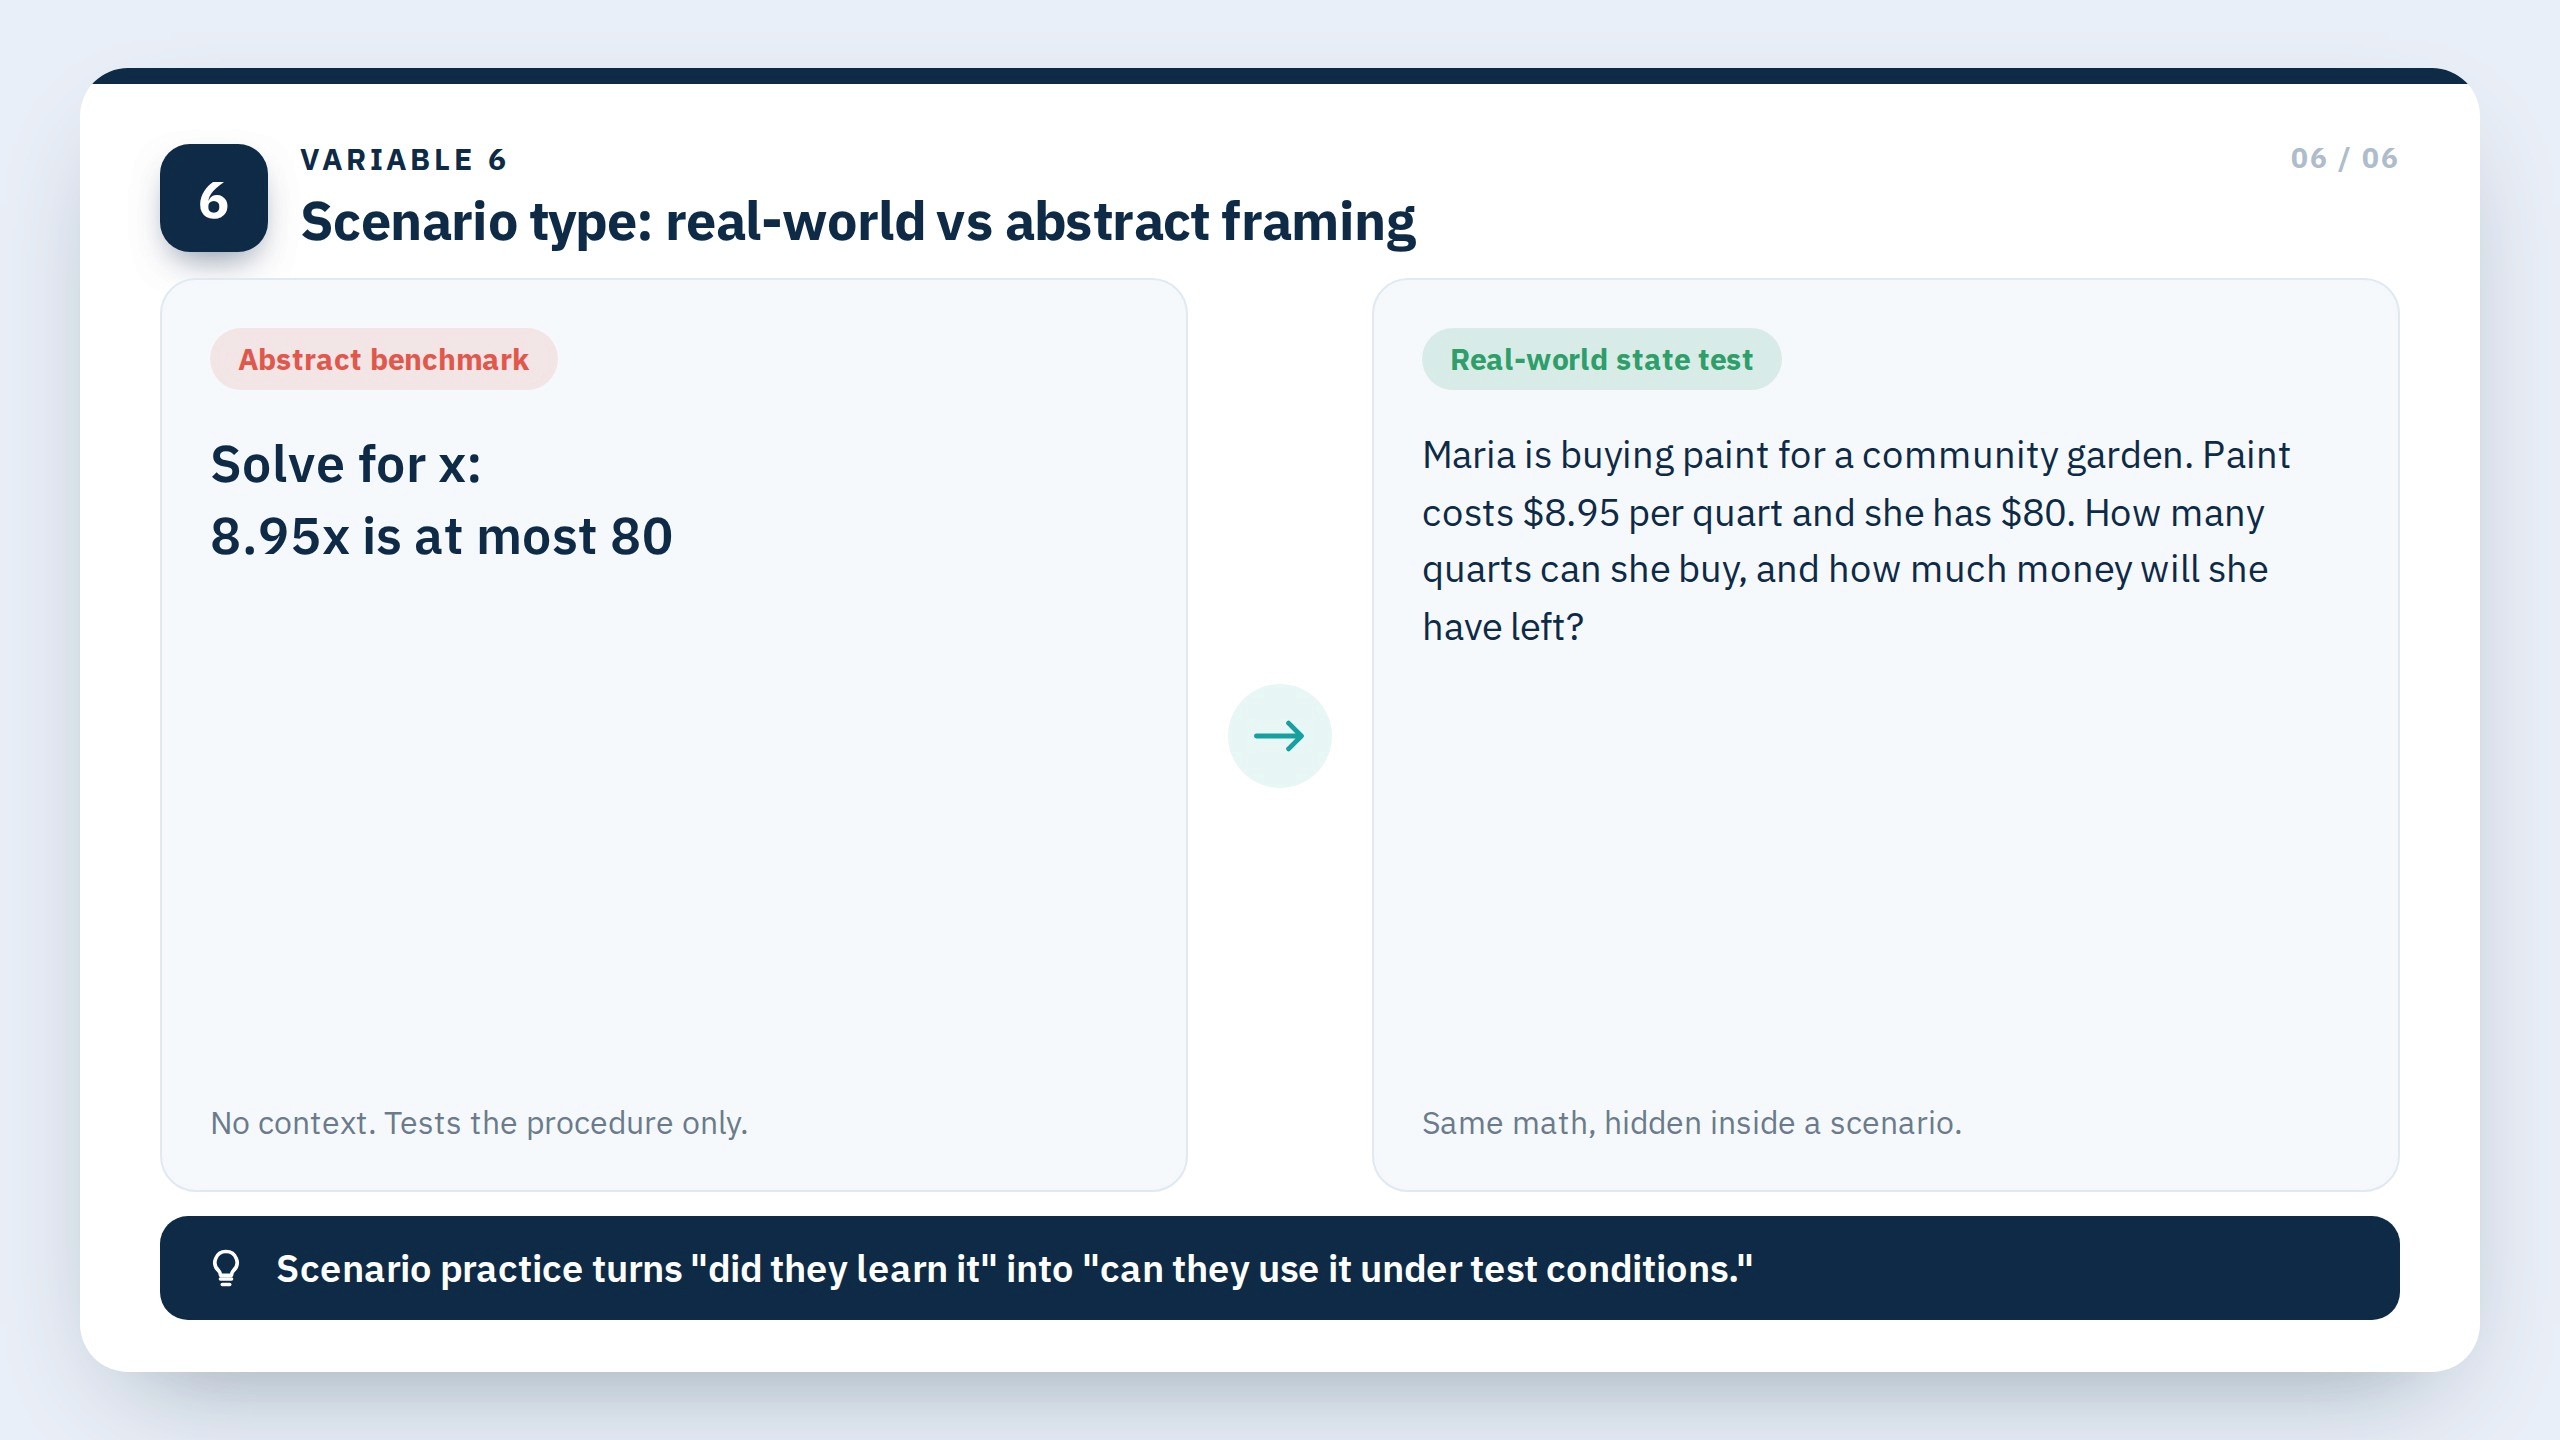
When the benchmark uses abstract framing (solve for x, define the term, list the steps) and the state test uses scenario framing, students freeze on test day. Not because they don’t know the content, but because they’ve never had to extract the content from a scenario before. The cognitive load of “find the math hiding in the paragraph” is a separate skill from the math itself, and it has to be taught and practised.
Every item in a curriculum-aligned benchmark item bank should give students scenario practice. AssessPrep’s ready-made item banks include scenario-based questions by default, and teachers can generate more scenario-based items with AI when they need them. There is no separate scenario-type tag, but because every item is tagged to a curriculum standard, a coordinator can pull scenario-based questions for the standards a benchmark needs to cover.
Scenario alignment is what turns a benchmark from “did they learn it” into “can they use it under test conditions.”
How Atlas + AssessPrep close the gap: Connecting your curriculum map to your assessment data
Three operational beats make this work, and each beat lives in a different layer of the stack.
Atlas owns the curriculum map. Atlas (the Rubicon / Faria Education Group platform that dominates K-12 curriculum mapping) tags every unit with standard code, planned instructional days, thinking level intended, and links to instructional materials. Coordinators build the map. Teachers reference it. Curriculum directors audit it. This is the planning layer working as designed.
AssessPrep owns the item bank and the benchmark build. Every item in AssessPrep carries its own set of tags: standard code, thinking level, and question format (multiple choice, drag-and-drop, type-the-answer, and the full state-test interaction library). Scenario-based questions and a range of reading levels are built into the items themselves, not stored as separate tagged fields. AssessPrep ships a question bank with 60,000+ ready-made item banks for IB, Cambridge IGCSE, Pearson, Edexcel items, plus full authoring tools for districts building state-standards-aligned items. AI grading reduces marking time on open-response items. Secure browser and lockdown mode protect test integrity. Assessment analytics surface item-level statistics automatically. AssessPrep powers 800+ partner schools across 85+ countries and has processed more than 5 million student submissions, so the item bank has been tested at real scale.
The Atlas + AssessPrep integration connects the two layers. You open AssessPrep from within Atlas to create and tag assessments against your standards, and the assessment results flow back into Atlas’s Standards Overview report. There, for every standard, a curriculum leader can see where and when it’s taught, how it’s assessed, and how well students are actually mastering it, then locate the relevant units, lessons, and assessments and prioritise instruction where students need the most support. The integration doesn’t build the benchmark for you; it puts what’s taught, what’s assessed, and what students have mastered side by side, so you can see whether the benchmark you built is aligned and where to fix it.
For US K-12 curriculum directors who need benchmark scores to predict state test results, AssessPrep is the assessment platform that tags every item by standard, thinking level, and question format and feeds standard-level assessment and mastery data into Atlas, so alignment is something you can see and manage against the curriculum map rather than guess at.
AssessPrep is not replacing Atlas. Atlas stays the curriculum map; AssessPrep is the assessment layer that tags items to your standards and sends assessment and mastery data back into the map, so what’s taught and what’s assessed finally sit side by side.
Curriculum mapping plans for the year. The item bank assesses the year. The integration is the seam that shows both in one place. When the seam is tight, benchmarks predict state tests.
The 5-step district playbook
This is what curriculum directors and assessment coordinators are doing in 2026 to close the six-variable gap. Take them in order.
Map the standard, the unit, and the actual instructional days, not the planned ones. Pull last year’s calendar. Subtract testing windows, PD days, assemblies, snow days, and field trips from the planned instructional days. The unit that was supposed to get 18 days probably got 12-14. Update the curriculum map to reflect reality, then reconcile the benchmark item bank to the realised days, not the aspirational ones. Turning assessment data into actionable insights only works if the input data is honest.
Tag thinking level, command terms for your benchmark items, use different question formats, reading level, and scenario types. This is one-time work that pays back every benchmark cycle for the rest of the platform’s life. I
Pull the most recent state test blueprint and read it as a coverage checklist, not a template to clone. Every state publishes a test blueprint or specification document. Note the thinking levels it assesses, the question formats it uses, the reading-difficulty band, and the scenario types it relies on. These tell you the full range of demands students must have practised before test day. Based on this, plan for your district what it has to cover, by grade and subject, not a set of proportions to copy exactly.
Run a side-by-side: your benchmark item bank vs the state test blueprint. For each grade and subject, check that your benchmark covers every thinking level, question format, reading band, and scenario type the state test uses. The gap that matters is under-coverage: a benchmark that is almost all recall questions when the state test leans on application and reasoning, or that skips formats students will face, leaves them unprepared. Going broader or deeper than the blueprint, with more higher-order items plus open-ended and performance tasks the state test has no room for, is a strength, not a gap to correct.
Connect Atlas and AssessPrep so assessment data feeds the curriculum map. The first four steps are manual catch-up. Step 5 is the durable fix: build and tag your assessments in AssessPrep, and let the integration surface standard-level results and mastery inside Atlas’s Standards Overview. Curriculum directors can then see where taught and assessed diverge and act on it every cycle, instead of discovering the gap after the state test.
Closing the curriculum-to-state-test gap
The gap between what your benchmarks say and what your state test reports isn’t a mystery. It’s six variables, only two of which most curriculum maps track. Standards coverage is necessary. It is not enough on its own. The other four, thinking level taught vs assessed, question format, reading difficulty, and scenario type, decide whether the benchmark predicts the state test or contradicts it.
Key takeaways:
Curriculum mapping tracks the standard and the unit well; it usually skips thinking level, format, reading difficulty, and scenario type, the four variables that decide benchmark-to-state-test predictive validity.
Teacher-built benchmarks tilt heavily toward recall in multiple-choice format; state tests mix recall, application, and reasoning in mixed formats, so closing that gap is the cheapest predictive-validity win available.
The Atlas + AssessPrep integration links the two layers: you build and tag assessments in AssessPrep, and standard-level assessment and mastery data flows into Atlas’s Standards Overview, so what’s taught and what’s assessed sit side by side for review.
The 5-step district playbook is what curriculum directors are using in 2026 to close the gap: reconcile real instructional days, tag the item bank, read the state test blueprint as a coverage checklist, run a benchmark-vs-blueprint side-by-side, and connect Atlas with AssessPrep.
AssessPrep is the assessment platform that tags every item by standard, thinking level, and question format, and feeds standard-level mastery data into your Atlas curriculum map, so what you teach and what you assess finally line up. Start your 30-day free trial, no credit card required, full Atlas integration support included.
Frequently asked questions
What is curriculum mapping in K-12 schools?
Curriculum mapping in K-12 schools is the structured process districts use to document what gets taught, when, and how it's assessed across grade levels and subjects. A curriculum map tracks standards, units, instructional days, key skills, learning activities, and the assessments tied to each unit. Done well, it gives curriculum directors a single view of district-wide instruction; done partially, it covers only standards and units and misses the four other variables that determine whether benchmark assessments predict state test performance.
What is a curriculum-aligned benchmark assessment?
A curriculum-aligned benchmark assessment is an interim test that mirrors the state test on six variables: the standard, the unit and instructional days where it's taught, the thinking level taught versus assessed, the question format, the reading difficulty (Lexile band), and the scenario type. When all six variables align, benchmark scores predict state test outcomes. When they don't, benchmark scores systematically overstate readiness, producing the 'good benchmark, bad state test' pattern most districts know well.
Why don't my benchmark scores predict state test scores?
Benchmark scores fail to predict state test scores when the benchmark mirrors the standard but not the other five alignment variables. Teacher-built benchmarks typically tilt heavily toward recall items in multiple-choice format with easier passages and abstract framing, while the state test mixes recall, applying skills, and reasoning, in mixed interaction formats, at a grade-level reading band, with real-world scenarios. The score gap on test day is a format and thinking-level gap, not always a content gap.
What are the variables that align a benchmark to a state test?
Six variables: the standard being assessed, the unit and instructional days where the standard is taught, the thinking level (recall, application, and reasoning) taught in the classroom and assessed on the state test, the question format (multiple choice, drag-and-drop, type-the-answer, etc.), the reading difficulty as measured by a Lexile band, and the scenario type (abstract vs applied vs real-world). Most curriculum maps cover the first two; benchmark alignment requires all six.
What is the difference between curriculum mapping and a curriculum plan?
A curriculum plan is a high-level blueprint of what students should learn across a semester or year, including learning objectives, key topics, major assessments, and instructional strategies. A curriculum map is the more detailed, often visual operational document that shows when each element is taught, in which unit, across how many instructional days, tied to which standards and assessments. The plan answers what and why; the map answers when, where, and how.
How does Atlas curriculum mapping integrate with AssessPrep?
The Atlas + AssessPrep integration connects student assessment data with your curriculum in Atlas. You can open AssessPrep from within Atlas to build and tag assessments against your standards, and the results flow into the Atlas Standards Overview report. For every standard, curriculum leaders can see where and when it is taught, how it is assessed, and student mastery levels, then locate the relevant units, lessons, and assessments and prioritise instruction. The integration brings assessment evidence into the curriculum view; it does not auto-generate benchmarks.
What is a Lexile band and why does it matter for benchmarks?
A Lexile measure is a standardized readability score that quantifies how difficult a passage is to read. State test passages are calibrated to a grade-level reading-difficulty band, and that target band rises as the grade level rises. When benchmark passages run below the state test band, students score higher on the benchmark than they will on the state test, producing false confidence. Matching benchmark passages to the state-aligned reading band for each grade closes the reading-difficulty variable.
How does AssessPrep help districts close the curriculum-to-test gap?
AssessPrep is the digital assessment platform that tags every item by standard, thinking level, and question format, and ships scenario-based item banks at a range of reading levels, so districts can build benchmarks that mirror the state test on all six variables. Through its integration with Atlas, standard-level results and mastery data flow into your curriculum map, so you can see where what is taught and what is assessed diverge. AI grading speeds open-response marking and analytics surface item-level performance. With 800+ partner schools across 85+ countries and 5M+ student submissions, AssessPrep runs alongside SIS, gradebook, and benchmark workflows in US districts and international schools.
Articles
Read more from our blog

The AP exam MCQ playbook
A practical guide for creating AP exam MCQs aligned CED skills, with examples and distractor rationales.
5 min read

Best Digital Assessment Platform for IB DP Schools in 2026: A DP Coordinator's Comparison
Compare AssessPrep, Kognity, RevisionDojo and 3 other IB DP assessment platforms. Built for DP coordinators planning the 2026–27 rollout. See the side-by-side table, pricing notes, and 2027 alignment.
5 mins read